
“ Measuring the variability and spread of data, particularly when robustness to outliers is desired ”

MAD measures the median of the absolute differences between each data point and the overall median of the dataset. This definition might sound complex, but let’s break it down.
MAD is a robust statistic, meaning it’s not easily affected by outliers or extreme values. This makes it particularly useful in scenarios where data may have anomalies.
Let’s imagine an example,
Imagine a group of friends standing in a line, each holding a sign with a number on it.
1.Find the middle friend:
- Arrange your friends in order from smallest number to largest number.
- The friend standing exactly in the middle represents the median of the group.
2. Measure the distances to the middle:
- Ask each friend to measure how far away their number is from the middle friend’s number.
- Don’t worry about whether they’re to the left or right, just focus on the distance.
- These distances are called absolute deviations.
3. Find the middle distance:
- Arrange the distances in order, just like you did with the numbers.
- The distance standing in the middle of this new line is the median absolute deviation (MAD).
Here’s why MAD is like a superhero:
- It’s tough and resilient! Outliers (those super high or low numbers that stand way out from the rest) don’t affect it much.
- It can handle skewed data (when most of the numbers are bunched up on one side).
- It’s easy to understand and calculate, even without fancy tools!
Think of MAD as the dependable friend who always stays close to the group, even when things get a little crazy!
It is calculated using the following formula:-
Decoding MAD’s Secret Formula:
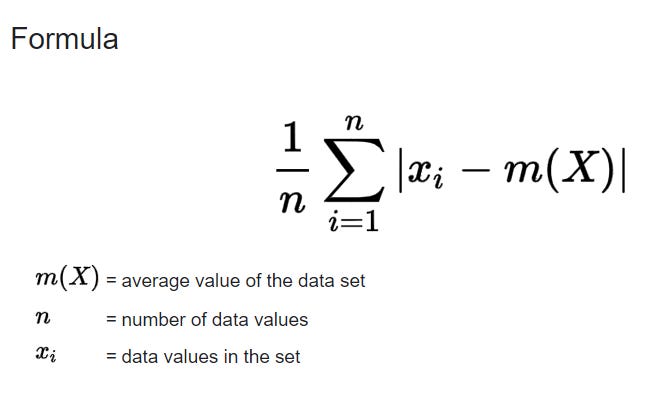
Steps to find out MAD:-
Step 1: Find the Median (M):
- Arrange the data points in ascending order.
- Identify the middle value, and if there’s an even count, average the two middle values. This is your median.
Step 2: Calculate Absolute Deviation (AD):
- For each data point, measure the absolute difference between the data point and the median.
- Ignore the direction; focus only on the distance.
Step 3: Determine the Median of Absolute Deviations (MAD):
- Arrange the absolute deviations in ascending order.
- The middle value in this new lineup is your Median Absolute Deviation (MAD).

Suppose we have data for the financial returns of various stocks and we need to find an extreme value and treat them before we make models or critical business decisions:-
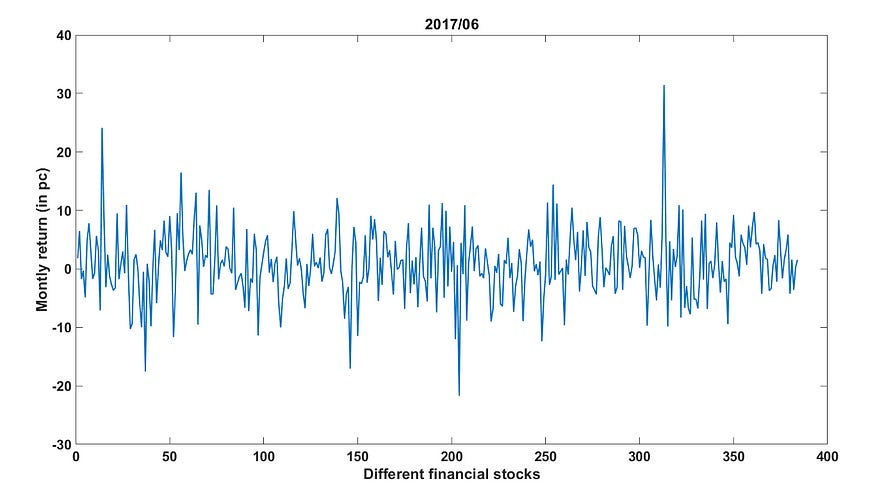
Now, by simply visualizing it we can easily see some peaks and lows but we need an outlier detection rule for the same.
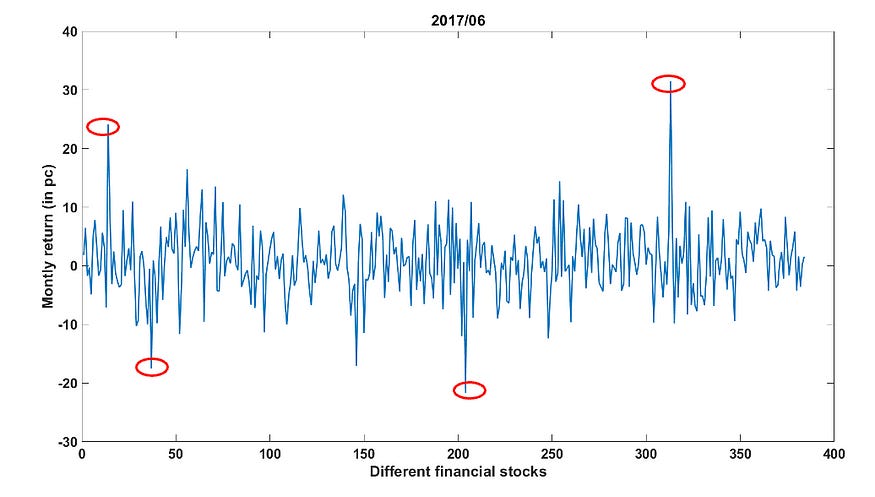
Now, if we take [ -30 to 30 ] Intervals we come up with the below,

But if we take [ -20 to 20 ] Intervals we come up with the below,
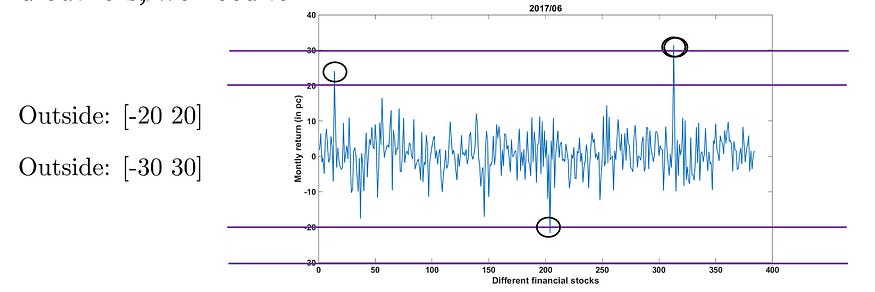
But now how to decide or fix the threshold,
Assuming my data is normally distributed, we can easily set a threshold,

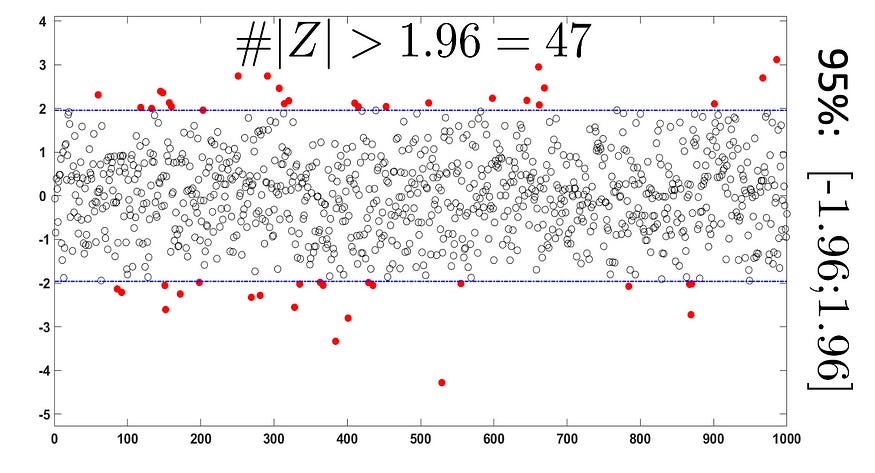
But how do we come up with [ -1.96; 1.96 ]?
Take one step back and try to remember the 68–95–99 Rule,
🌟 68% of the data falls within 1 standard deviation of the mean
🌟 95% of the data falls within 2 standard deviations of the mean
🌟 99.7% of the data falls within 3 standard deviations of the mean
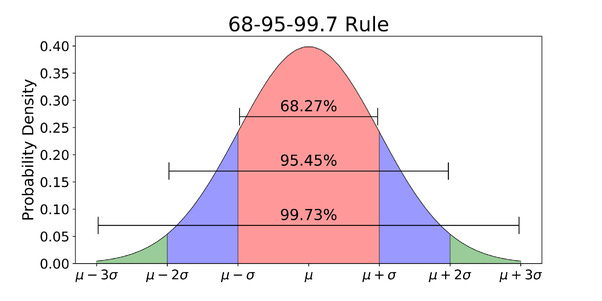
More Precisely,

Now we set a 95% threshold which means within 2 standard deviations of the mean and mathematically,

Now, In the case of our stock data, after some maths, we come up with an Interval [ -10.62; 12.45 ]
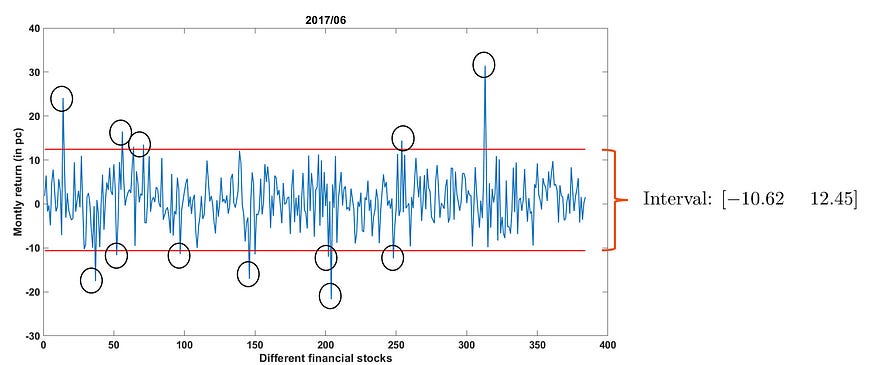
Now, mathematically potential outlier becomes, this


But Statistics is not that simple, here comes the surprise,
Let me tell you the problem here,
Imagine, I was sitting in the bar and enjoying my beer. To everyone’s surprise, Elon Musk walks in. I think he wants some drink after openAI suing almost backfired him 😂

I can now say that the average income status of all customers in the bar, including myself, is now in the billions.
A perfect example of how to lie with statistics. Be careful while using average, it can be mean to you 😆
Say Hi Median & MAD ✌️
Stay with me and now Imagine a dataset:-

Step — 1 Sort the data in ascending order.
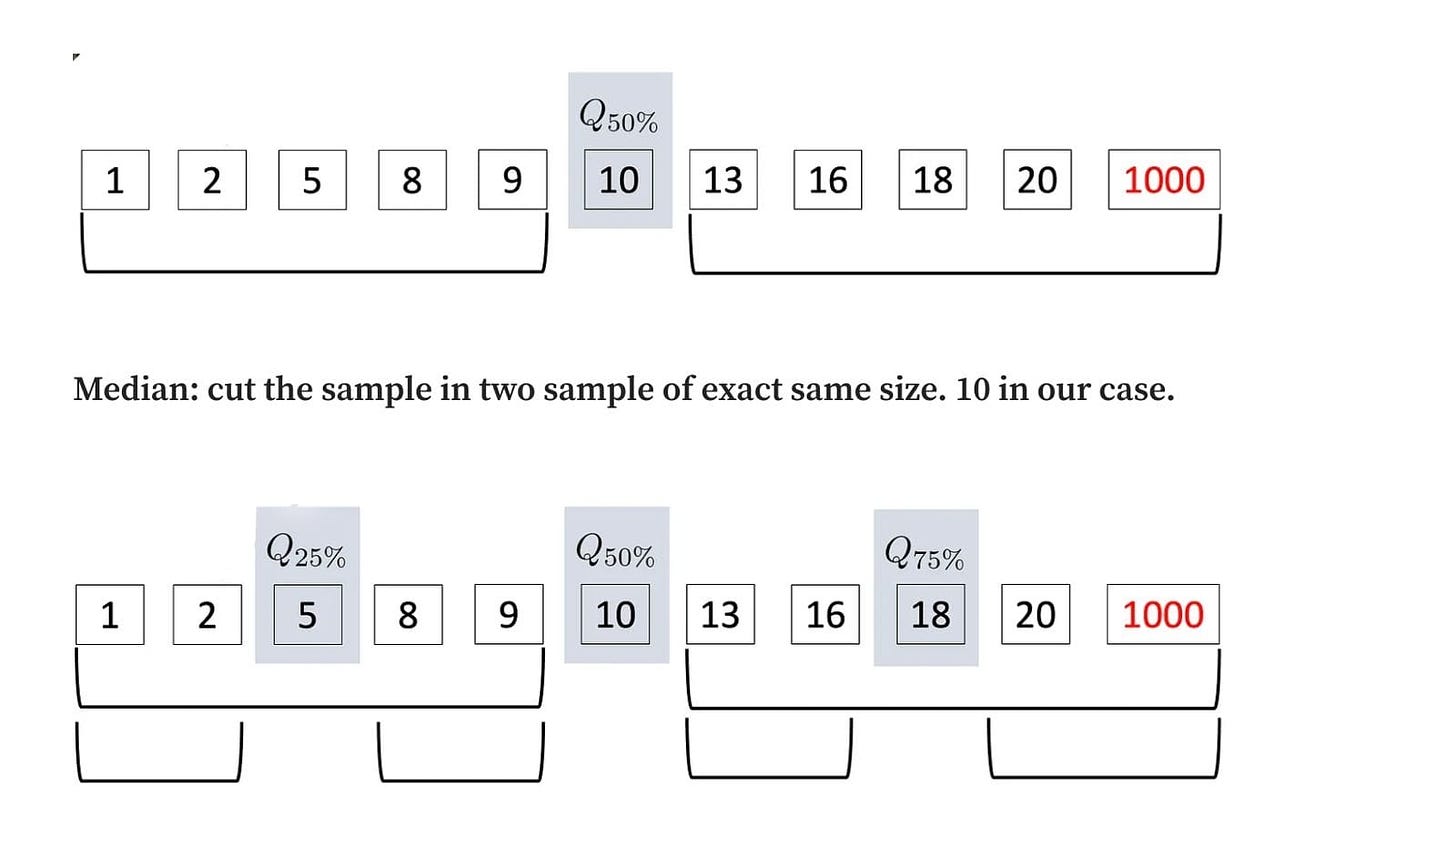
1st quartile: cut the first split sample into two samples of the same size 5 in our case.
3rd quartile: cut the 2nd split sample into two samples of the same size. 18 in our case.
Now Let’s calculate the MAD by using the below formula:-

Step -1:- Subtract every observation ( xi ) from the Median ( 10 ).

Step — 2 Repeat it for every observation


Finally,

You got your MAD.😁
In Nutshell, you find the median of the data which divides the data equally on Left side and right side and calculate the absolute difference from the calculated median again.
Bonus Tip:- Feel free to skip this Tip, I have just learned during my masters. It’s core stats, no one will ask you this in Interviews 👍
Link MAD to Normal distribution,
In this case, data is distributed around the mean,
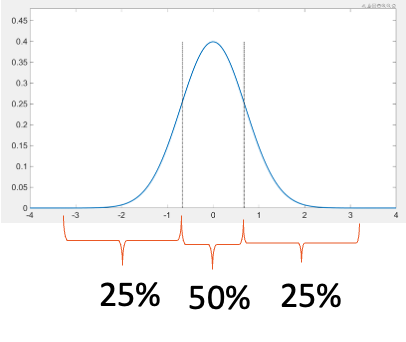
You can learn this which is proven mathematically:-
For a normal distribution:


where,

Two possible outlier detection approaches:
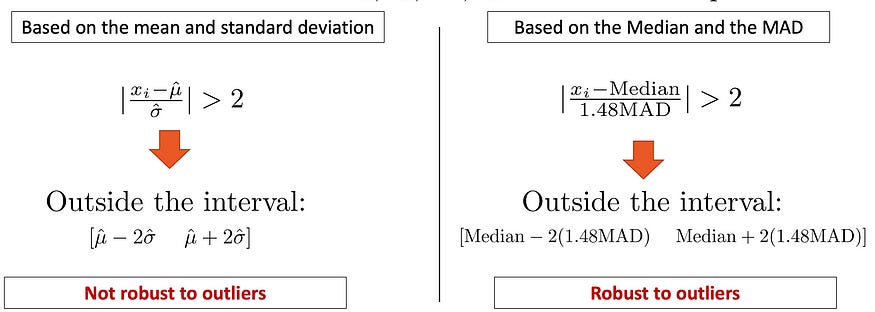
In simple just calculate the value of MAD & Median, compute in the formula, and enjoy the beer with Elon Musk 🙋

Interpretation of MAD

Facts
The variance and Standard deviation are also measures of spread, but they are more affected by extremely high or shallow values and non—normality. The standard deviation is usually the best choice for assessing spread if your data is normal. However, if your data isn’t normal, the MAD is one statistic you can use instead.
Also, MAD measures the average absolute deviation and standard deviation takes the square root of the average squared deviations.
Not Commonly Used: Standard deviation is more commonly used in statistical analyses and may be more familiar to practitioners and stakeholders.
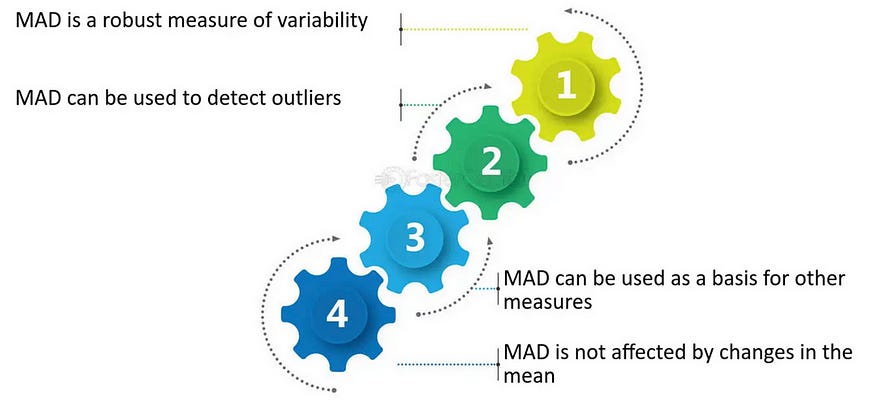
Python Code
# Using Scipy to Calculate the Median Absolute Deviation
from scipy.stats import median_abs_deviation
numbers = [86, 60, 95, 39, 49, 12, 56, 82, 92, 24, 33, 28, 46, 34, 100, 39, 100, 38, 50, 61, 39, 88, 5, 13, 64]
median_absolute_deviation = median_abs_deviation(numbers)
print(median_absolute_deviation)
Thanks to Mr. Arnaud DUFAYS, my professor used many images & stock examples from his slides.
About the author

If you love reading this blog, share it with friends! ✌️
Tell the world what makes this blog special for you by leaving a review or like here 🙂 😁


