A branch of mathematics concerns data collection, analysis, and interpretation.
In its broadest sense, statistics is the science of analyzing data, which refers to a collection of tools and methods for evaluating, interpreting, displaying, and making decisions based on data.
I found this little boring definition because 😁
But If I would say:-
When you think about Statistics, what is your first thought? You may think of information expressed numerically, such as frequencies, percentages, and averages.
Just looking at the TV news and newspaper, you have seen the inflation data in the world, the number of employed and unemployed people in your country, the data about mortal incidents in the street and the percentages of votes for each political party from a survey. All these examples are statistics.
Wells some individuals refer to statistics as the mathematical analysis of technical data. Keeping the “Official” definition aside, statistics is a way of inferring meaning from a large dataset.
But why need the Statistics?
When we have created a prediction model, we must assess the prediction’s reliability.
After all, what is a prediction worth, if we cannot rely on it?
The Truth is that we choose the sample and then make predictions about it and assume that our population follows the same and thats the main objective.
Population vs. sample
In statistics, a population includes every possible element we are interested in measuring or the entire dataset we want to conclude about.
While a sample is a subset of the population.
For instance, a population might be the set of:
- All students at a university
- All the cell phones ever manufactured by a company
- All the forests on Earth
Samples drawn from the above populations might be:
- The math majors at the university
- The cell phones manufactured by the company in the last week
- The forests in Canada
A very Easy Peasy example is:-
Now practically we can not infer a population, that’s not possible and feasible so now the Role of Statistician is to make sure the Sample we are choosing is the best representative of the population and most importantly formulas (or estimates) or sample parameters should be as closest as possible to the population parameter.

The Properties a Statistician cares about are:-
Unbiasedness, Consistency, and Efficiency

Hence one of the many crucial responsibilities of a statistician is to continuously refine the accuracy of sample parameters to closely reflect population parameters.
This involves tasks such as outlier detection, handling missing values, identifying relationships and correlations, analyzing and selecting appropriate distributions, ensuring assumptions — like normality — are met, treating categorical variables, creating dummy variables, applying the right transformations, conducting statistical tests like T-tests, Z-tests, or ANOVA, and choosing the appropriate methods for Normalization or Standardization. All of this, along with selecting the right model and loss function, contributes to the statistician’s ongoing effort to achieve the most accurate results. 😁
These are just a few of the things I can recall at the moment, but in reality, there are countless other aspects to consider. That’s the nature of Data Science — it’s all about managing these complexities to uncover meaningful insights.
Types of Statistics

I would encourage you to read the in-depth blog Descriptive & Inferential Statistics.
A Short Introduction:-
Descriptive Statistics:-
Describe characteristics of the responses, such as the average of one variable (e.g., age), or the relation between two variables (e.g., age and creativity).

Refer Blog — Descriptive Statistics
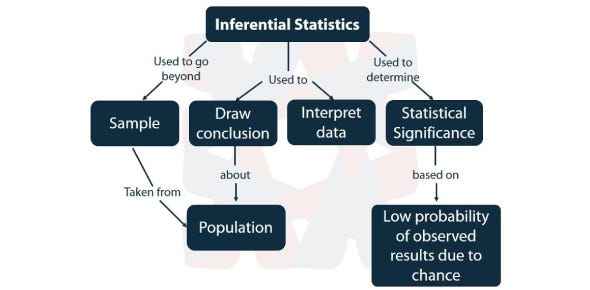
Inferential Statistics:-
It helps us to decide whether our data confirms or refuses our hypothesis and whether it is generalise a larger population.

Also,

Refer Blog — Inferential Statistics
Nutshell,

In summary, statistics is fundamental to data science, providing the theoretical foundation and practical tools needed to analyze data, build models, and make data-driven decisions. The below image says it all. ✌️

In last, take it easy — Just remember to enjoy the process because, In life & Statistics with time & more historical data, everything becomes Normally distributed — Hakuna Matata ✌️ !!

Connect with me on LinkedIn
If you love reading this blog, share it with friends! ✌️
Tell the world what makes this blog special for you by leaving a review or like here 🙂 😁


Somebody essentially help to make significantly articles Id state This is the first time I frequented your web page and up to now I surprised with the research you made to make this actual post incredible Fantastic job