Introduction
In today’s digital age, the terms “data” and “big data” are frequently mentioned, especially in the context of technology and business. But what exactly do these terms mean?
What is Data?

Data refers to information that is collected, stored, and used for various purposes. It can be anything that provides facts, figures, and details about an entity.
It’s a common misconception that data is exclusively about numbers. In reality, data encompasses any form of information that conveys insights, patterns, or meaning. F
For example, the images and hieroglyphs carved on Egypt’s pyramids are also a form of data. These carvings represent historical narratives, cultural practices, and religious beliefs of ancient civilizations. Just as numerical data can reveal trends and patterns, these visual and symbolic forms of data provide us with rich insights into the past, offering a window into the lives and minds of people from thousands of years ago.

Thus, data isn’t confined to spreadsheets and statistics; it includes any medium that captures and communicates information.
Next,
What is Big Data?
When I ask people about Big Data, the typical response is that it’s simply “huge data.” While that’s technically correct, it’s a superficial understanding that even a high school student might offer. As an aspiring data scientist, it’s crucial to delve deeper and break down Big Data into its meaningful characteristics.
History
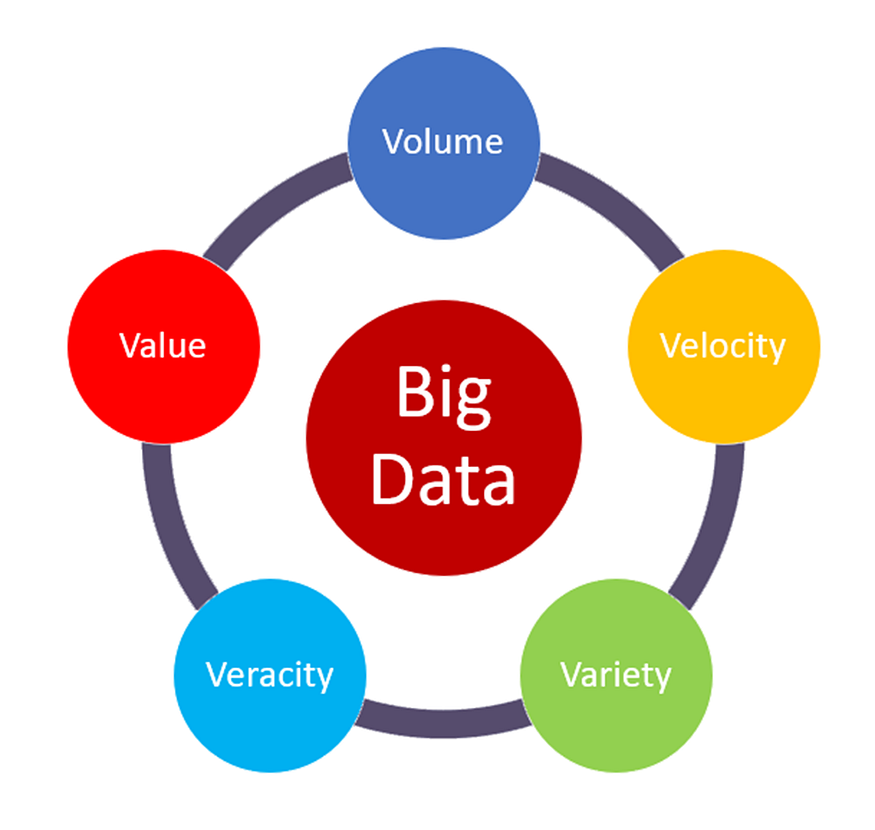
It started in the year 2001 with 3 V’s, namely Volume, Velocity and Variety. Then Veracity got added, making it 4 V’s. Then Value got added, making it 5 V’s. Later came 8Vs, 10Vs, etc.
For now, Big data is characterized by the 5Vs:
Big Data is not just about the sheer volume of data; it’s defined by a set of key attributes often referred to as the “5 Vs”: Volume, Velocity, Variety, Veracity, and Value.

1. Volume: ( Magnitude )
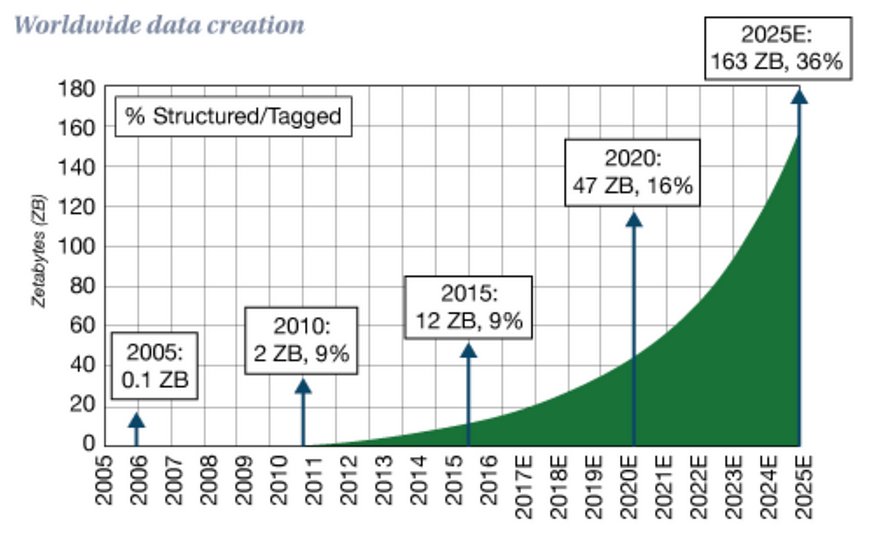
- This is the most obvious characteristic, referring to the vast amounts of data generated every second from various sources and the sheer amount of data generated every second. For instance, social media platforms, sensors, and online transactions produce massive amounts of data.
- Example: Facebook generates 4 petabytes of data per day.

The Data we created in the last 2 decades,

2. Velocity: ( Speed )
- The speed at which new data is generated and processed. In the age of the internet, data is being created at unprecedented rates.
- Example: The continuous stream of tweets, likes, and shares on social media.
Consider this: every time you perform a Google search or make a transaction online, you’re generating a single data point. Now, imagine how many people around the world are conducting similar transactions every second, every minute, and every day.
Think about the vast number of individuals shopping on Amazon, or making payments with their credit or debit cards. The sheer speed at which these transactions occur — whether per second, minute, day, or even quarter — contributes significantly to the overall volume of data being generated.

This continuous and rapid generation of data points is a key aspect of Big Data, specifically referred to as velocity. Velocity isn’t just about how fast data is produced, but also about how quickly it needs to be processed and analyzed to be valuable. The constant flow of data from countless sources, like e-commerce transactions or financial activities, adds to the ever-growing volume of Big Data.
3. Variety: ( Diversity )
Variety in Big Data refers to the diversity of data types and sources, which can present significant challenges when trying to integrate and analyze the information.
For instance, imagine you have sales data coming from one source at a monthly granularity, while profit data is coming from another source at a weekly granularity. This disparity in data types, formats, and levels of detail exemplifies the complexity of handling diverse data.
To tackle these challenges, various tools and techniques are employed. In Excel, VLOOKUP functions are often used to match and merge data from different sources. In more advanced data environments, SQL joins are commonly utilized to combine datasets based on shared keys, allowing for more complex and dynamic data integration. Similarly, in Python, the .merge() function serves as a powerful tool to align and combine data from different sources, ensuring consistency and coherence in your analysis.

4. Veracity: ( Accuracy )

- The quality and accuracy of the data. High veracity means the data is trustworthy and reliable. Low veracity means the data might be messy or misleading, This is including structured, unstructured, and semi-structured data.
- Example: User-generated content that may include errors or misinformation.

1. Structured Data:
- This type of data is organized and formatted in a way that makes it easily searchable in databases. Examples include spreadsheets, SQL databases, and tables where data is arranged in rows and columns.

2. Unstructured Data
- This data does not have a predefined structure or organization, making it more difficult to collect, process, and analyze. Examples include emails, social media posts, images, and videos.

3. Semi-Structured Data:
- This type of data does not fit neatly into the structure of a database but contains tags or markers to separate elements. Examples include JSON and XML files.

But I firmly believe, and someone rightly said

5. Value: ( Usefulness )

- Finally, the ultimate goal of Big Data is to extract valuable insights that can drive decision-making, innovation, and competitive advantage. Without value, Big Data is just a large collection of information with no practical use.

How is Big Data Processed?
Processing big data involves several tools:
As Big Data continues to grow in scale and complexity, the need for advanced tools and technologies has become essential. Tools like Tableau and Power BI are crucial for visualizing vast datasets, allowing us to turn raw data into insightful, interactive dashboards that can be easily interpreted.

SQL remains fundamental for querying and managing data, helping to extract specific insights from massive databases.

When dealing with terabytes or even petabytes of data, cloud solutions like AWS and Redshift are indispensable. They offer scalable storage and management capabilities, enabling efficient handling and processing of enormous datasets.

For automation, tools like Alteryx and Python scripts streamline the Extract, Transform, Load (ETL) process, making data preparation faster and more reliable.


Moreover, Python has become a cornerstone in the realm of data science, not just for data manipulation, but also for powering machine learning and deep learning models. These models are essential for uncovering patterns, making predictions, and driving innovation from Big Data.

In summary, the vast and complex nature of Big Data necessitates the use of smart tools and technologies at every stage — from data storage and management to analysis and visualization. These tools are what enable us to unlock the true potential of Big Data, transforming it from a massive collection of information into actionable insights.
Reality:-

Among all the tools available, Excel remains a favorite for many, largely due to its flexibility and accessibility. Excel offers a wide range of functionalities, from data visualization to basic modeling, making it a versatile tool for various analytical tasks.
With its intuitive interface and powerful features like pivot tables, charts, and formulas, Excel can handle a surprising amount of data manipulation and analysis, making it indispensable for many professionals.
However, Excel does have its limitations, particularly when it comes to handling large datasets. The maximum row limit of 1,048,576 is a constraint, and even well before reaching this limit — often around 200,000 rows — Excel can become sluggish, leading to slower performance and potential crashes. This limitation is where more robust tools like SQL, Python, and specialized data visualization platforms like Tableau or Power BI become necessary. These tools are designed to handle and process larger datasets efficiently, allowing for more complex analyses without the performance issues that Excel might encounter.

Key Takeaways
- Understanding Data Types: Data can be structured, unstructured, or semi-structured, and each type has its uses and challenges.
- Five Vs of Big Data: Big data is characterized by Volume, Velocity, Variety, Veracity, and Value, each adding complexity and significance to data management.
- Importance of Big Data: Big data enables better decision-making and strategic planning across various industries like business, healthcare, finance, and transportation.
- Processing Big Data: Effective big data processing involves collection, storage, analysis, and visualisation to derive meaningful insights.

Bonus Tip 😁


