Descriptive Statistics — What happened in the past !!

Let’s summarize or describe the historical data to understand what has happened in the past.

Descriptive Statistics
Descriptive statistics involves summarising and organizing the data so they can be easily understood. We typically describe the data in a sample. Descriptive analytics is often the first step in the data analysis process, providing a foundation for further analysis.
In Quantitative research, after collecting the data the first step of statistical analysis is to describe the characteristics of the responses, such as the average of one variable(e.g., salary), or the relation between two variables (e.g. Height and Weight). We analyze the data using different plots and charts on different kinds of data(numerical and categorical) like bar plots, pie charts, scatter plots, histograms, etc.

Key points of Descriptive Statistics:
1. Do not conclude the data.
2. Do not try to perform predictions based on available data.
3. Do not try to fit the model to the data.
Most importantly, we cannot perform any analysis. if we do not understand the data we won’t work well.
How do you know all observation records are correct?
1. Detect Outliers
2. Plan how to prepare the data
3. Base to feature Engineering
4. Visualisation is important to descriptive Statistics to have a good sense of data as discussed above as well.
Three kinds of Descriptive Statistics depend on how many variables are involved.
1) Univariate
Describes the data /summarise the data of a single variable. For example, examining the ages of students in a classroom.

Univariate consists:
- Frequency — Count
- Measure of central tendency — Mean, Median, Mode
- Measure of Dispersion — Range, Variance, and Standard Deviation
2) Bi-variate
Describe the data /summarise the data of two variables, such as examining the relationship between hours studied and exam scores for students.

Bi-variate consists:
- Covariance
- Correlation
3) Multivariate
Describe the data /summarise the data of more than two variables. for instance, examining the relationship between hours studied, hours slept, and exam scores for students.
Multivariate consists:
- Covariance Matrix
- Correlation Matrix:

Types of Descriptive Statistics?

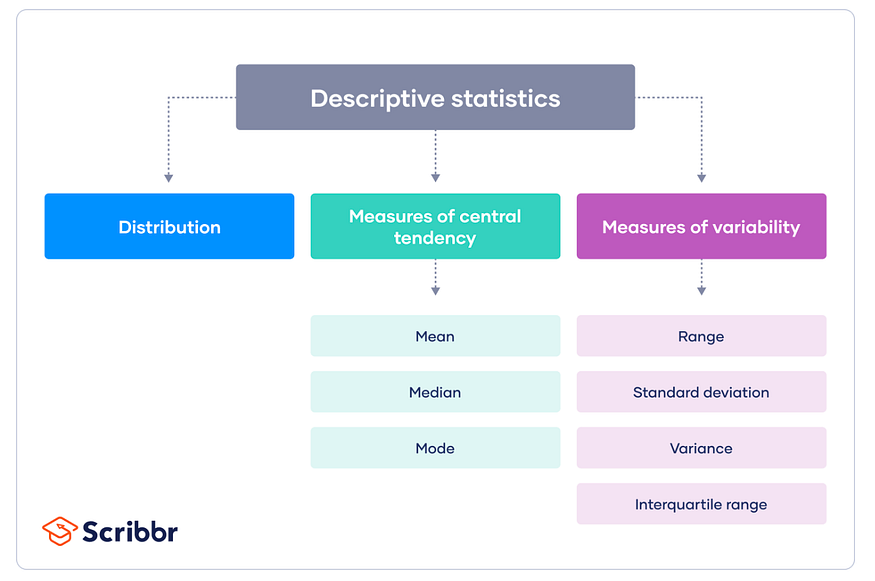
Descriptive statistics are broken down into two categories.

- Measures of central tendency
- Measures of variability (spread).

In this article, we will study an overview of the understanding of the measure of Central Tendency.
I highly recommend to read the detailed blogs about Mean, Median and Mode written by me. I am sure you will like it.
The measure of Central Tendency
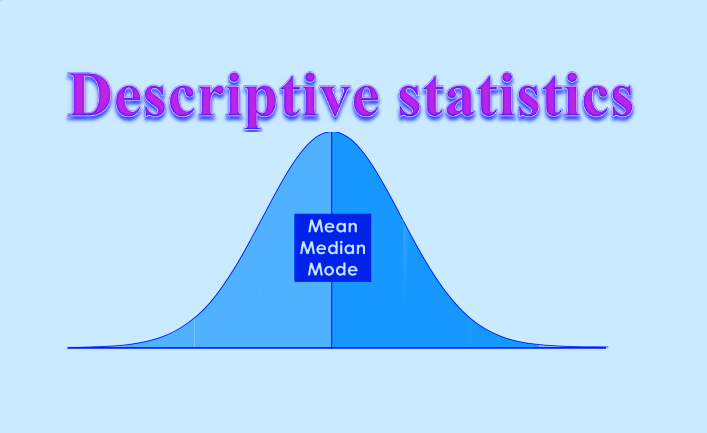
Central tendency refers to the idea that there is one number that best summarises the entire set of measurements, a number that is in some way “central” to the set.
Mean / Average
Mean or Average is a central tendency of the data i.e. a number around which the whole data is spread out. In a way, it is a single number that can estimate the value of the whole data set.

Must Read — Detailed explanations of MEAN
Median: is simply the middle value of a dataset.
- Applicable for an interval, ordinal, and ratio data
- Not applicable for nominal data
Case 1: N is Odd

Case 2: N is Even

In Nutshell,

Must Read — Detailed explanations of MEDIAN
Mode: Mode is the most frequently occurring value in a dataset. — Most Frequent term
Applicable for all levels of data measurement (nominal, ordinal, ratio, and interval)

Must Read — Detailed explanations of MODE.
Let’s conclude this:-

Measures of Spread
One of the most common ways to measure the spread of our data is by looking at the Five Number Summary. It consists of five values:
- The minimum: The smallest number in the dataset.
- The first quartile Q1: The value such that 25% of the data falls below.
- The second quartile Q2(≈ median): The value such that 50% of the data falls below.
- The third quartile Q3: The value is such that 75% of the data falls below.
- Maximum: The largest value in the dataset.
We represent the five-number summary with a boxplot as shown below

About the Author

Reach out to me on Linkedin — https://www.linkedin.com/in/tarunsachdeva7997/
Do Like and Share:- Happy Learning !! Thanks


