
“It’s the weight on the extreme ends of a distribution.”

The topic of Kurtosis has been controversial for decades now, the basis of kurtosis all these years has been linked with the peakedness but the ultimate verdict is that outliers (fatter tails) govern the kurtosis effect far more than the values near the mean (peak).
Now, think of punching or pulling the normal distribution curve from the top, what impact will it have on the shape of the distribution?
Let’s visualize:
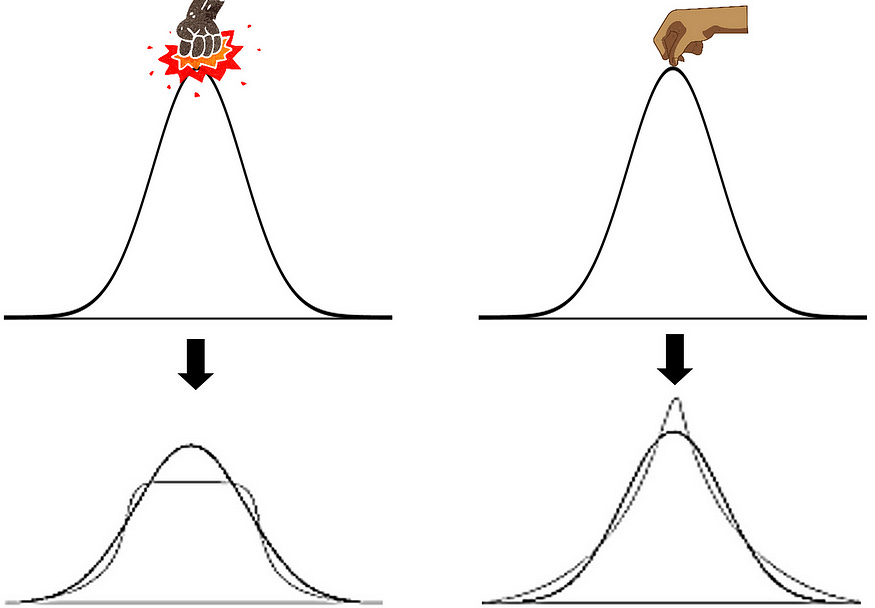
So there are two things to notice —
- The peak of the curve.
- The tails of the curve.
Interesting 😩 But Is there any Easy Peasy, Lemon Squeezy way !!

The story goes like this:
Imagine you’re going grocery shopping with your parents. Since they have their hands full, they ask you to carry two, five kg bags on each arm. You grudgingly agree and carry each 5 kg bag in each arm.
Now, you notice something. The closer the bags are to your body, the easier they are to carry. The farther outstretched your arms are from your body, the harder it gets to manage the weights.
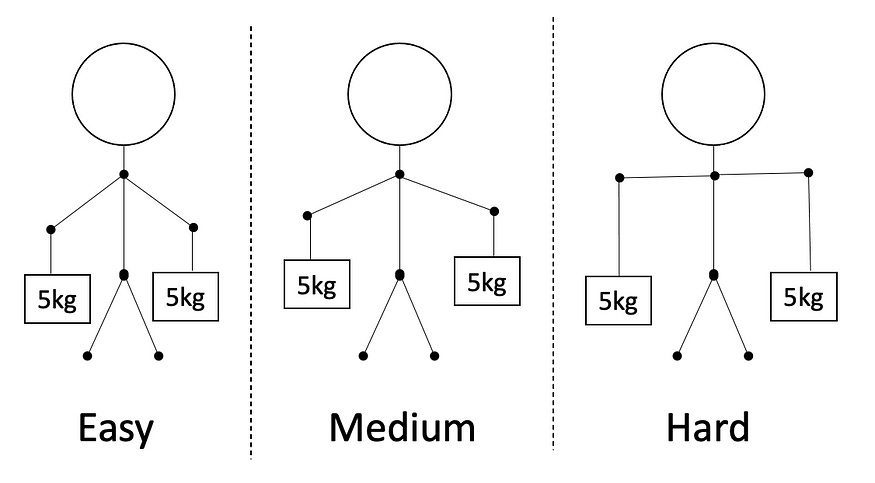
In this particular example, the farther you move away from your body, the harder it gets and the higher the kurtosis.
The distance from your center of gravity in the above example is proportional to the intuition of kurtosis (and the difficulty of managing the weights) or can be said as equal to kurtosis for the sake of simplicity.
Now if we increase the weight from 5kgs to 10kgs and then to 15kgs, the difficulty starting from easy to medium to hard also goes up rapidly and so does the kurtosis value.
Now replace yourself in the above example with a normal distribution probability density function. Since most of your weight is concentrated very close to your center of gravity, you are said to have a Pearson’s kurtosis of 3 or Fisher’s kurtosis of 0. — Bear with me for kurtosis values.
Few points to remember before we move on:-

Firstly, Kurtosis ranges from 1 to infinity.
Secondly, It’s okay if you can’t remember this, but in any case,
kurtosis is described in terms of excess kurtosis, which is kurtosis − 3, and as a proven fact Normal distributions have an excess kurtosis of 0.
The kurtosis ( Normal ) measure for a normal distribution is 3

Excess Kurtosis for Normal Distribution = 3 ( Kurtosis )– 3 = 0
Since it ranges from 1 to infinity the lowest value of Excess Kurtosis is when Kurtosis is 1 = 1–3 = -2
As the kurtosis ( Normal ) measure for a normal distribution is 3, we can calculate excess kurtosis by keeping reference zero for normal distribution. Now excess kurtosis will vary from -2 to infinity.
In simple words, comparing a distribution’s kurtosis to a normal distribution makes things easier after all it is mother of all distributions and keeping this as reference standard would be easy to interpret as well.
Types of Kurtosis:-

More statistically,
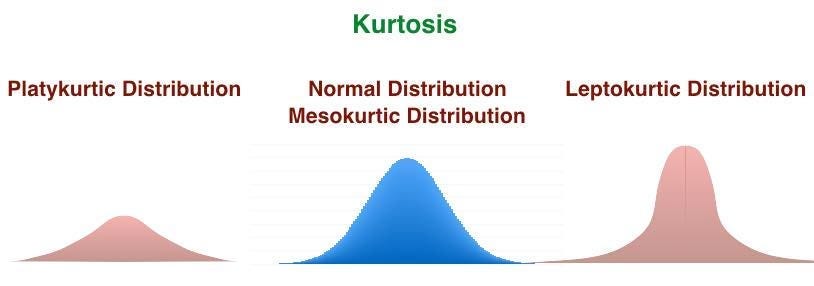

In one shot it would be,
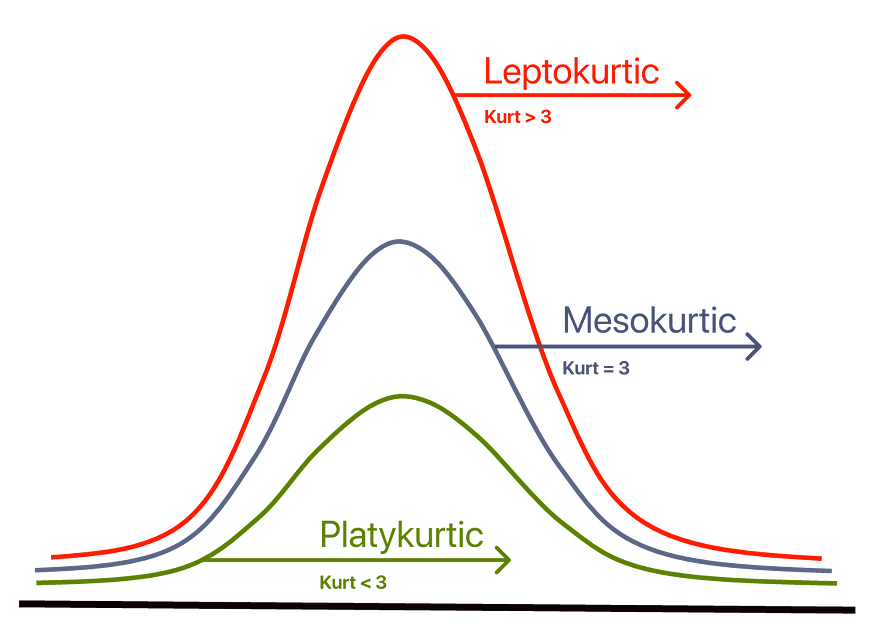
But,

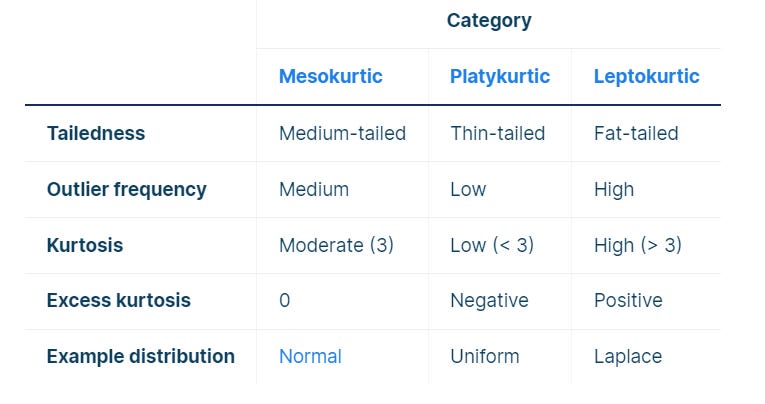
Mesokurtic- Medium Tailed || Symmetric || Less-Outliers || K = 3
A normal distribution with a kurtosis of 3 is called mesokurtic, eventually, a symmetric type of distribution and outliers are neither highly frequent nor highly infrequent.
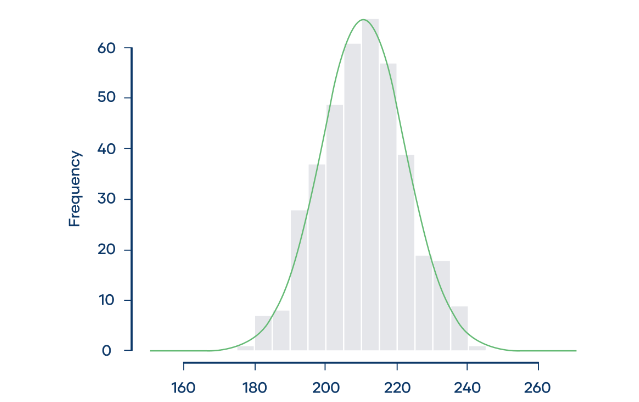
In this case, the kurtosis is 3.09 and the excess kurtosis is 0.09, and we conclude that the distribution is mesokurtic.
Platykurtic- Thinner Tails || Short distribution || Few Outliers || K < 3
A Distribution with a low presence of extreme values compared to Normal Distribution, then lesser data points will lie along the tail. In such cases, the Kurtosis value will be less than Three with a thinner tail.
Platykurtosis is sometimes called negative kurtosis since the excess kurtosis is negative.
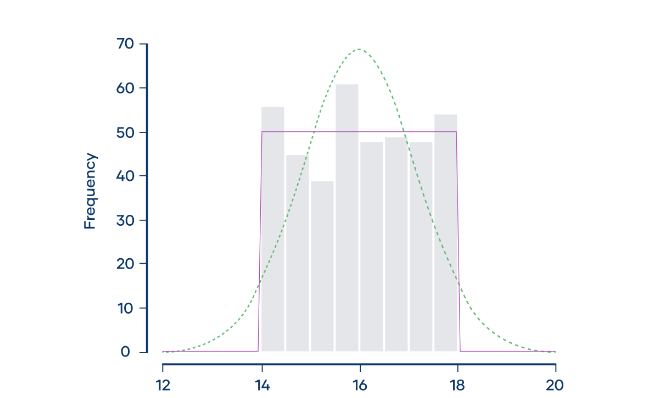
The frequency distribution (shown by the gray bars) doesn’t follow a normal distribution (shown by the dotted green curve). Instead, it approximately follows a uniform distribution (shown by the purple curve). Uniform distributions are platykurtic with fewer outliers.
Leptokurtic- Fat Tails || Wide Distribution || Freq. Outliers || K > 3
A leptokurtic distribution is fat-tailed, meaning that there are a lot of outliers. Leptokurtic distributions are more kurtotic than normal distributions. They have:
Leptokurtosis is sometimes called positive kurtosis since the excess kurtosis is positive.
For example, Imagine that four astronomers are all trying to measure the distance between the Earth and Nu2 Draconis A, a blue star that’s part of the Draco constellation. Each of the four astronomers measures the distance 100 times, and they put their data together in the same dataset.
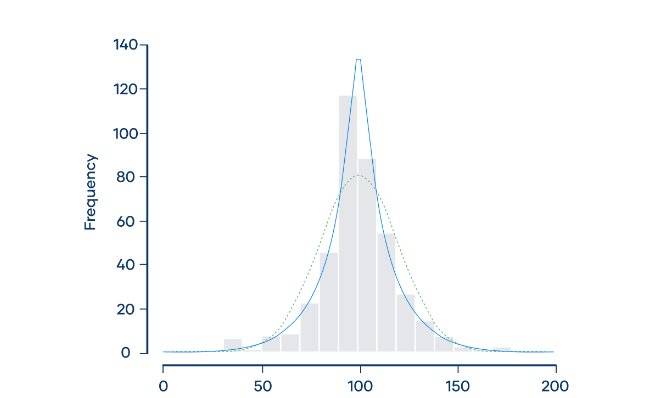
The frequency distribution (shown by the gray bars) doesn’t follow a normal distribution (shown by the dotted green curve). Instead, it approximately follows a Laplace distribution (shown by the blue curve). Laplace distributions are leptokurtic.
The distribution of the astronomers’ measurements has more outliers than you would expect if the distribution were normal, with several extreme observations that are less than 50 or more than 150 light-years.
To conclude,
OR

Why Is Kurtosis Important?

Kurtosis explains how often observations in some datasets fall in the tails vs. the center of a probability distribution. In finance and investing, excess kurtosis is interpreted as a type of risk known as tail risk, or the chance of a loss occurring due to a rare event, as predicted by a probability distribution. If such events are more common than predicted by a distribution, the tails are said to be “fat.”
Also, the Interpretation of Kurtosis
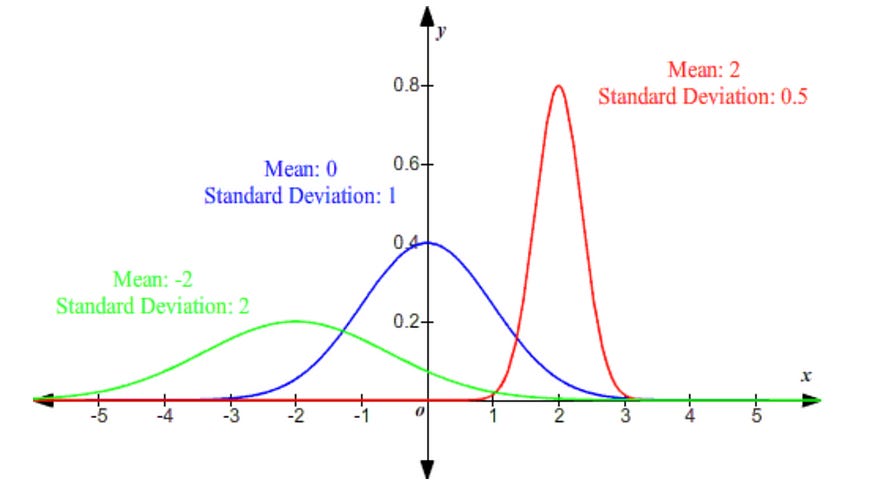
Kurtosis can be understood with the help of Standard Deviation.
The smaller the Standard Deviation, the Steeper the Distribution whereas the Higher the Standard Deviation, the Flatter the Distribution.😎
Is Kurtosis the Same As Skewness?
No. Kurtosis measures how much of the data in a probability distribution are centered around the middle (mean) vs. the tails. Skewness instead measures the relative symmetry of a distribution around the mean.
The Bottom Line
Kurtosis describes how much of a probability distribution falls in the tails instead of its center. In a normal distribution, the kurtosis is equal to three (or zero in some models). Positive or negative excess kurtosis will then change the shape of the distribution accordingly.
For investors, kurtosis is important in understanding tail risk, or how frequently “infrequent” events occur, given one’s assumption about the distribution of price returns.
How Is Kurtosis Used in Finance?
In finance, kurtosis is used to assess the risk of extreme returns in investment portfolios by analyzing the tailedness of return distributions. A higher kurtosis indicates a greater probability of significant deviations from the mean. This means an investment with higher kurtosis is more likely to deviate from its average return.
Is a High Kurtosis Good or Bad?
A higher kurtosis is not inherently good or bad; it depends on the context and the investor’s risk tolerance. For instance, high kurtosis indicates more frequent extreme values or outliers, which can imply higher risk and potential for large gains or losses. For some investors, this is good; for others, it’s bad.
What we learned:
Kurtosis, in very simple terms, is the weight on the extreme ends of a distribution. In the above example, the weights farther away from your center of gravity were harder to handle/manage.
Fisher’s kurtosis compares how tail-heavy a distribution is concerning a normal distribution (regardless of its mean and standard deviation).
Distributions, which have 0 or very close to zero Fisher kurtosis are called Mesokurtic distributions. Normal distribution falls under this bucket.
Distributions, that are uniform or flat-topped, have negative Fisher’s kurtosis and are also called platykurtic distributions. Ex: uniform distribution
Distributions with high positive Fisher’s kurtosis are called leptokurtic distributions. Leptokurtic distributions are ‘tail-heavy distributions that suffer from outliers that may require handling or processing depending on the use case. Ex: Levy distrbution, laplace distribution etc.
In the end the formula for computing kurtosis:

Don’t take this much seriously, 😎
import pandas as pd
data = {

'values': [1, 2, 3, 4, 5, 6, 7, 8, 9, 10, 11, 12, 13, 14, 15] }
df = pd.DataFrame(data)
# Calculate kurtosis
kurtosis = df['values'].kurtosis()
print(f'Kurtosis: {kurtosis}')
Bonus Tip :
Prof. Karl Pearson has called all this as “ Convexity of a curve”

Connect with me on LinkedIn, and I’d appreciate a review on Google
Subscribe to this if you want my blogs in your Inbox.
For training inquiries, drop me an email at tarunsachdeva7997@gmail.com
If you love reading this blog, share it with friends! ✌️
Tell the world what makes this blog special for you by leaving a like 😁

Remember to explore DataMantra’s additional blogs, which are available.
- Understanding Data & Big Data
- The Power of Comprehensive Guide to various data types
- Statistics — Its all about reliability !!
- Mean — The Average, my best guess of all time !!
- Median — The Middle Most Term
- Mode: The Most Frequent & Common Term in Stats
- Range — A Measure of Spread
- Variance & SD — How far data is spreaded !!
- The Essence of Un-Biased MAD
- Outlier — An odd & special one out
- Outliers — Let’s deep dive with Example
- The Central Limit Theorem: Random things tend to follow a predictable pattern.
-
Law of Large Numbers — More Numbers More Statistical Stability


My brother suggested I might like this blog He was totally right This post actually made my day You can not imagine simply how much time I had spent for this info Thanks