Normal Distribution — Mother of All Distribution

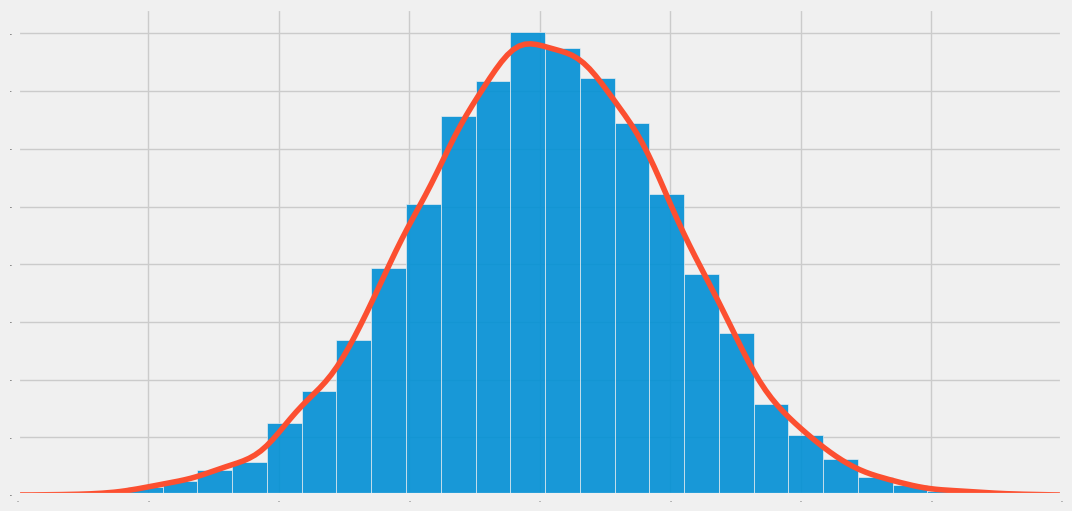
Normal distribution, also known as Gaussian distribution or Bell curve, is a statistical pattern where data clusters around a central average value with decreasing frequency as values deviate further from the average.
It is characterized by a symmetrical, bell-shaped curve when graphed, with the majority of data points concentrated near the mean and progressively fewer points dispersed towards the extremes.
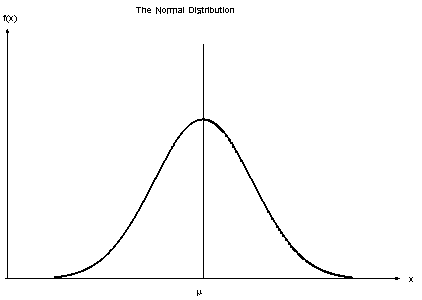
The shape of the normal distribution is symmetric and unimodal. It is called the bell-shaped or Gaussian distribution after its inventor, Gauss.
The visual appearance is given below.


For Example:
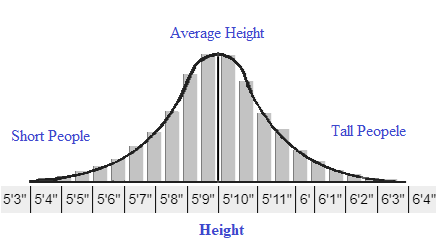
Imagine you’re measuring the heights of a bunch of people. You might find that most people are around the average height, with fewer people being much taller or much shorter. This pattern of data is what we call a normal distribution.

At the heart of normal distribution is something called the “Bell Curve.” Picture a bell-shaped curve with the peak in the middle representing the average height, and the curve tapering off symmetrically on either side.
Similarly, Normal distribution pops up all over the place in the real world. From heights and weights to test scores and even natural phenomena like rainfall, many things follow this pattern.
But why does it happen?
Well, it’s often due to something called the “Central Limit Theorem,” which says that when you add up a bunch of random stuff (like the heights of a bunch of people), you tend to get a normal distribution. Now, normal distribution isn’t just about describing data; it’s also super useful for making predictions.
For example, let’s say you know the average height of a population and how spread out the heights are (we call this the standard deviation). With that information, you can use the normal distribution to estimate how likely it is to find someone of a certain height.
Properties of Normal Distribution
- Symmetrical Shape: The normal distribution curve is perfectly balanced, with the same number of observations on each side.
- Equal Central Measures: In a normal distribution, the mean, median, and mode are all the same, pointing to the center where data is most frequent.
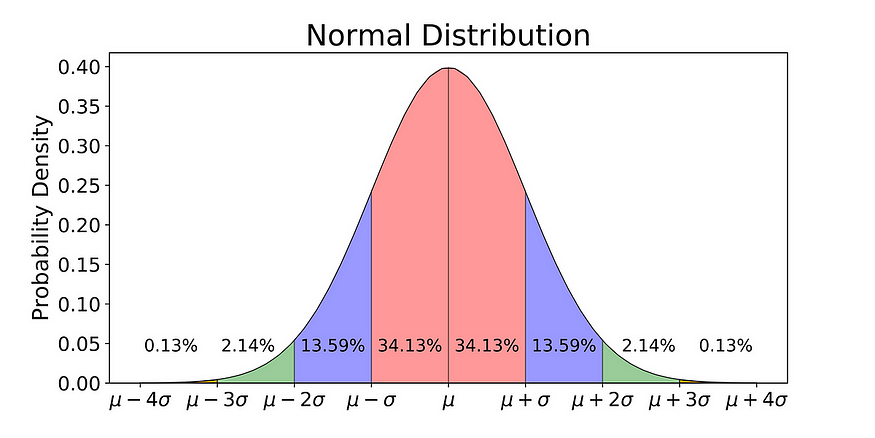
- Empirical Rule: Nearly all data (about 99.7%) falls within three standard deviations of the mean in a normal distribution, helping to understand its spread and predict outcomes accurately.

Key Takeaways
- Normal distribution, represented by the bell curve, shows how data clusters around an average with decreasing frequency as values deviate.
- This statistical pattern is pervasive across diverse fields, from human characteristics like height and weight to natural phenomena such as rainfall.
- Standard deviation, a measure of data dispersion, determines the width of the bell curve in normal distribution.
- Understanding normal distribution aids in interpreting data effectively and making informed decisions.
ABOUT THE AUTHOR

Harshit Sanwal
Marketing Analyst, DataMantra


