Understanding the T-Distribution: A Simple Guide
When you step into the world of statistics, you’ll encounter various distributions, each with its unique characteristics and applications.
One such distribution is the T-distribution, which plays a crucial role in statistical inference, particularly when dealing with small sample sizes.
Let’s delve into what the T-distribution is.
What is the T-Distribution?
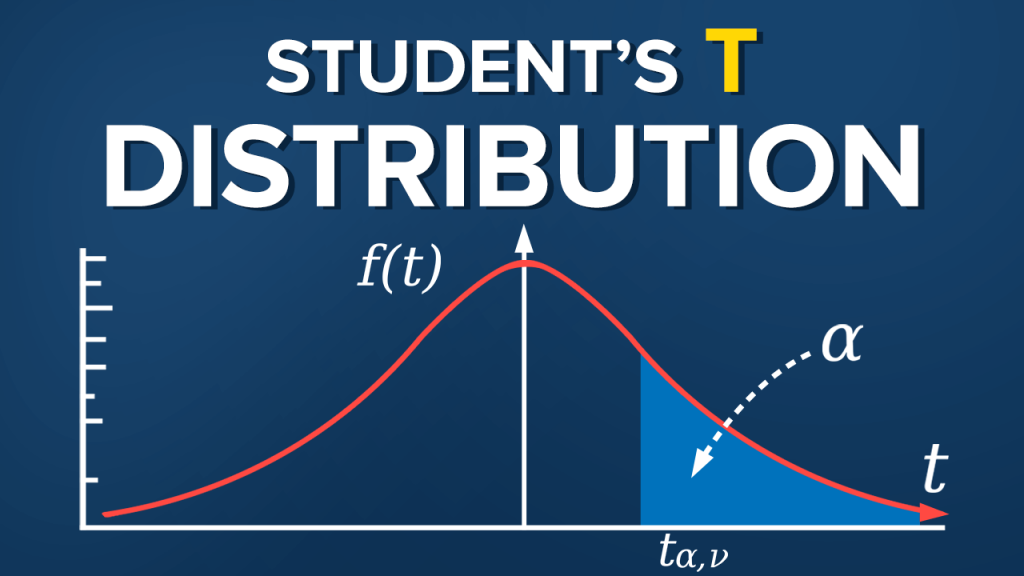
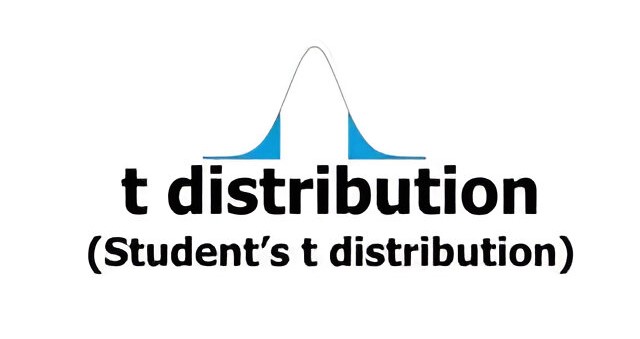
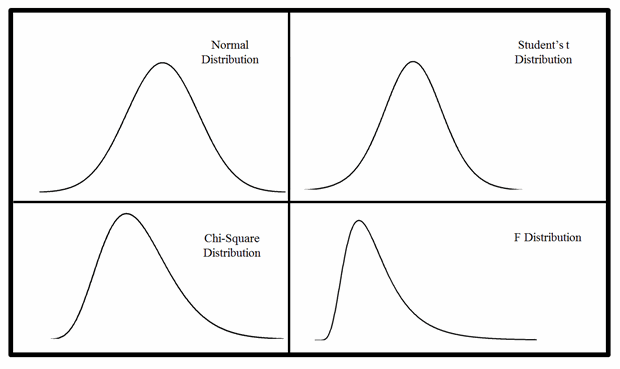
The T-distribution, also known as Student’s T-distribution, is a probability distribution that is symmetric and bell-shaped, much like the normal distribution.
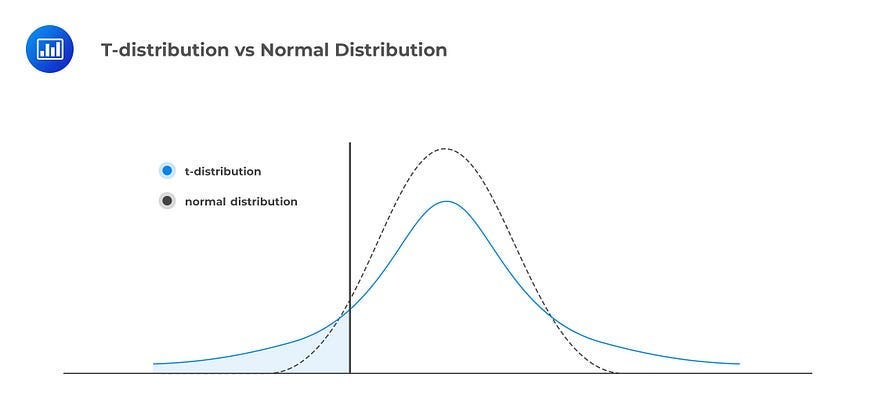
However, it has heavier tails, meaning it has more probability in the tails compared to the normal distribution. This characteristic makes it particularly useful when working with small sample sizes or when the population standard deviation is unknown.
Key Characteristics:
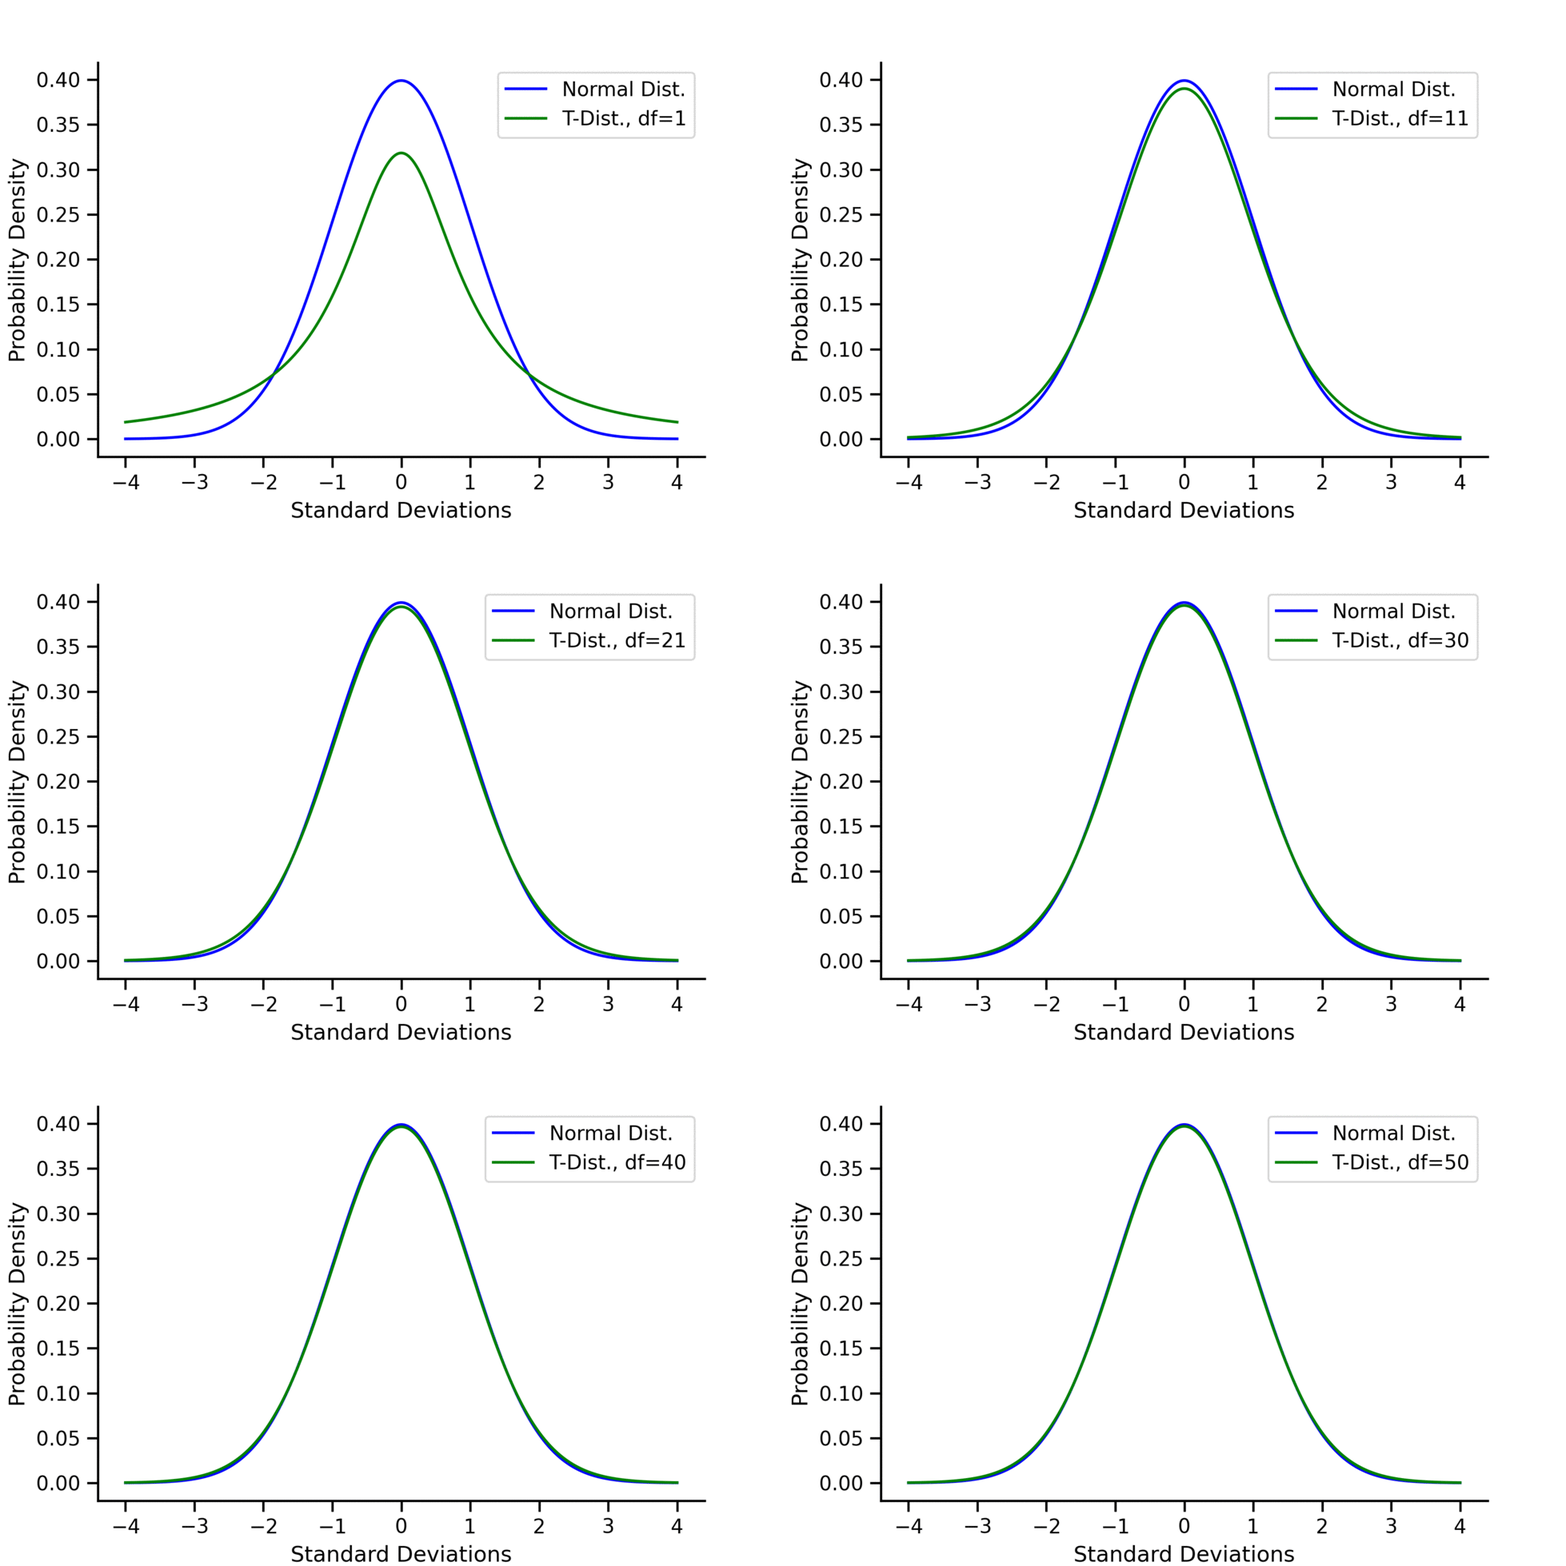
- Shape: The T-distribution’s shape depends on a parameter called degrees of freedom (df). As the degrees of freedom increase, the T-distribution approaches the shape of the standard normal distribution.
- Heavier Tails: Unlike the normal distribution, the T-distribution has thicker tails, meaning it allows for more variability in the data, which is crucial when working with small samples.
Uses of the T-Distribution:
- Inference for Small Samples: When dealing with small samples (typically fewer than 30 observations), the T-distribution is used to estimate population parameters such as the mean or difference between means.
- Confidence Intervals: T-distribution is used to calculate confidence intervals for population parameters, especially when the population standard deviation is unknown.
- Hypothesis Testing: In hypothesis testing, particularly when the sample size is small or the population standard deviation is unknown, the T-distribution is used to determine the probability of observing a sample statistic given a null hypothesis.
- Regression Analysis: In linear regression, the T-distribution is used to assess the significance of regression coefficients and to construct confidence intervals around predicted values.
Key Takeaways:
- Sample Size Matters: The T-distribution is particularly handy when working with small sample sizes. As the sample size increases, the T-distribution approaches the normal distribution.
- Degrees of Freedom: The shape of the T-distribution depends on degrees of freedom. More degrees of freedom result in a distribution that closely resembles the normal distribution.
- Robustness: The T-distribution is robust to violations of normality assumptions, making it a valuable tool in many real-world scenarios where data may not perfectly follow a normal distribution.
In conclusion, the T-distribution is a versatile tool in statistics, especially when working with small samples or when the population standard deviation is unknown. Understanding its characteristics and applications can greatly enhance your ability to make meaningful inferences from data, even in challenging situations.
Happy Learning!
ABOUT THE AUTHOR

Harshit Sanwal
Marketing Analyst, DataMantra


